Mapping Process in Mrima-Mombasa
By Edwin Simiyu and Nyasani Mbaka
This write-up describes the mapping process of all households living in informal settlements in Mrima settlement of Mombasa, Kenya as carried out by Muungano wa Wanavijiji and supported by Muungano Support Trust.
This process included training of community members on how to collect map data on each household, numbering each structure and practical use of the GIS (Geographic Information System) shapefiles to carry out the actual mapping of the households. It also included the preparation of detailed maps defining the boundaries of all house structures along with features of the site, with a level of accuracy and detail needed for service provision, planning, upgrading and providing secure tenure.
The data from the map helped to inform the residents of each settlement about their needs, and supported their collective discussions about priorities. The mapping in these settlements is part of the profiling, enumeration and mapping of the settlements within Kenya and in many other nations, supported by organizations and federations of the urban poor.
Definitions
Muungano wa Wanavijiji is a nationwide federation of the urban poor that seeks to improve the quality of life of its members through an extensive process of policy advocacy and dialogue with government (both central and local), civil society and private sector organizations. By and large, the federation proactively engages its members in savings schemes as a way of pulling their resources together towards realizing a common end.
Muungano Support Trust (MuST), is a professional secretariat of the Muungano wa Wanavijiji. The secretariat admirably brings together professional innovators who have journeyed with the federation for over a decade now. Notably, MuST is in the business of innovating for social transformation through competitive organizing, community planning and project innovation.
A Geographic information system (GIS) is a computer-based tool for mapping and analyzing spatial data. GIS technology integrates common database operations such as query and statistical analysis with the unique visualization and geographic analysis benefits offered by maps. These abilities distinguish GIS from other information systems and make it valuable to a wide range of public and private enterprises for explaining events, predicting outcomes, and planning strategies. GIS is considered to be one of the most important new technologies, with the potential to revolutionize many aspects of society through increased ability to make decisions and solve problems.
Informal settlements are defined as residential buildings built on “planned” and “unplanned” areas which do not have formal planning approval. They are characterized mostly by low quality houses and the lack of/or inadequate infrastructure and social services.
Overview of Mombasa
Mombasa is the oldest city and second in importance to Nairobi (the capital city of Kenya). Mombasa has an approximate total land mass of 230 sq.km and inshore waters covering approximately 65 sq.km. The original Arabic name is منبعثة Manbasa; in Swahili it is called Kisiwa Cha Mvita (or Mvita for short), which means "Island of War", due to the many changes in its ownership. The town is also the headquarters of Mombasa District, which, like most other districts in Kenya, is named after its chief town.
The city has a population of 939,370, as per the 2009 census, and is located on Mombasa Island, which is separated from the mainland by two creeks: Tudor Creek and Kilindini Harbour. The island is connected to the mainland to the north by the Nyali Bridge, to the south by the Likoni Ferry and to the west by the Makupa Causeway, alongside which runs the Kenya-Uganda Railway. The port serves both Kenya and countries of the interior, linking them to the Ocean. The city is served by Moi International Airport located in the northwest mainland suburb of Chaani, northwest of Changamwe area.
Mombasa, Kenya is located at -4.05 [latitude in decimal degrees], 39.6667 [longitude in decimal degrees]. The average elevation of Mombasa, Kenya is 1 meters
Overview of Mrima settlements
Mrima settlement is found in Likoni area which is in Mombasa South network of the Muungano wa Wanavijiji Coast Region.
Mrima settlement consists of five clusters namely Nairobi area, Mathare, Land, Majengo Mapya and Madunguni. All the five clusters are located on government land according to an inventory carried out in the month of April in the year 2010.
Overview of Donglomarati settlements
Donglomarati settlement is found in Chaani location of Changamwe area within the Mombasa West network of Muungano wa Wanavijiji.
Donglomarati settlement consists of five settlements commonly referred to us Chaani Donglomarati. The five settlements are Mbuyuni, Dunga Unuse, California, Half London and Ng’ombeni. The settlements are located on government land according to the inventory carried out in the year 2010 and there has been eviction threats to the residents especially Dunga Unuse.
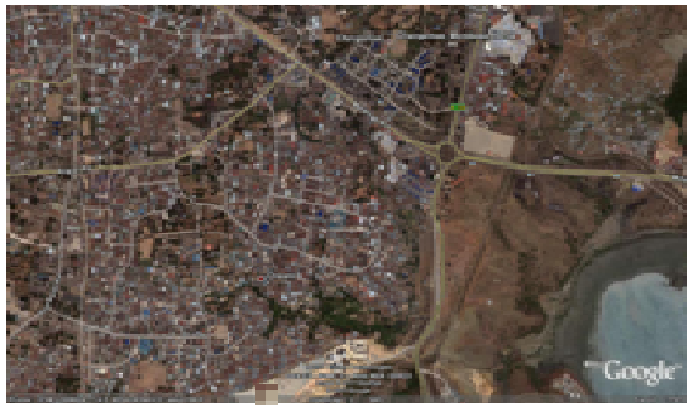
Figure 2: A Google earth display of Chaani area of Mombasa West
MAPPING
Mapping of informal settlements
The starting point for this discussion is the recognition that large-scale, replicable upgrading of informal settlements as well as service delivery is only possible through the use of spatial information technologies. At the same time, there is the need to recognize that the primary objective of mapping has to be the social and economic development of the community. Therefore, if GIS is to be used effectively, it has to support this process. It is not simply a technical tool to underpin physical development. In fact, were this to be its sole function, it would have failed. Rather, it should be seen as a tool that liberates local authorities, communities and professionals from the constraints of paper-based space, and allows for the interaction between the spatial and physical elements on the one hand, and the social and economic opportunities on the other, in a three-dimensional virtual environment.
This then allows all parties to work in a much more interactive way to address the multi-faceted nature of informal settlements.
The first major use of GIS, as a planning tool in informal settlement upgrading, was in Belo Horizonte in Brazil, in 1983. Since then there has been extensive use of GIS as a mapping tool within the SDI fraternity in order to add value to the enumerations data. One way through which the enumerations have been improved within the SDI fraternity has been through the use of mapping. Mapping of informal settlements, for instance, has helped in negotiations for basic services in general and upgrading in particular. In a bid to sharpen the capacities of affiliates around mapping activities, SDI arranged a GIS training programme for the African hubs. The first training was conducted in the East African hub which was then followed by the Southern Africa hub training. The latter drew SDI participants from Malawi, Namibia, South Africa, Zambia, Swaziland and Zimbabwe and was facilitated by the Kenyans who have a very long and rich history of mapping-based enumerations.
Mapping process
The mapping process starts with mobilization of the community members which is usually done by Muungano wa Wanavijiji. Mobilizing communities to get involved in the mapping process helps ensure they own the maps and can use them for their own purposes. In the same way, community-based mapping provides a visualization of community space that acts as an alternative to that offered by government mapping initiatives. Furthermore, the process of creating maps helps people develop a familiarity with maps and area-based representations of their communities, allowing them to evaluate externally produced maps more confidently and negotiate more knowledgeably.
Need identification: Oncecommunity has been mobilized, thecommunity members go through a process of identifying the need to collect map information. Once the need has been identified, discussions are then held to identify when and how to collect the map information. Where data is required by the state, Muungano wa Wanavijiji will identify existing groups in the community and initiate discussions.
Awareness Creation: Muungano wa Wanavijiji then holds consultative meetings with various interest groups /stakeholders in the community to build consensus on the enumeration and mapping data required. This also provides a forum for Muungano wa Wanavijiji to create awareness on the various activities that Muungano wa Wanavijiji involves in. some of the teams that Muungano has used to make its work successful include;
1) Projects team (to deal with housing and other projects chosen by the members)
2) Welfare team (to support members e.g. visiting the sick members)
3) Audit team (to carry out auditing of the federation activities to ensure accountability and transparency)
4) Savings and loans
5) Enumeration and mapping
6) Muungano Development Fund (MDF)
It is at this stage that the community members are encouraged to join some of these teams and generally to be members of the federation.
Team selection and training: an inclusive and representative team from the community is selected in an open forum. The roles of the members are defined based on strengths and experience. Training is then facilitated by Muungano Support Trust (MuST) and other Muungano wa Wanavijiji members who have participated in the process before and hence acquired the expertise in mapping.
Often exchange tours to participate in mapping in other settlements are organised. This can be at the level of Muungano network (local exchange), Muungano region (regional exchange), Muungano national (national exchange) or even international federations within the SDI network (international exchange). During the training, conventional signs are agreed upon for representing the various features on the map.
Numbering: This is the first step in the actual mapping process.A numbering sheet is developed to collect information of importance during the numbering process. An example of a numbering sheet used in the mapping of Mrima settlements is shown in Table 1. A numbering code formulated and agreed upon during the training stage is then used. The formulation of the numbering code is based on the settlement clusters established from communities mental maps as well as the general layout of the settlement. The basic numbering unit is the household level. This number then becomes a unique identifier of each mapped family as well as structure. It is at this stage that challenges are identified and a deeper understanding of the structure of the settlement is attained and the enumeration strategy concretised.
Table 1: Numbering sheet for Mathare cluster of Mrima settlement
ID
HOUSE NO:
STRUCTURE NO:
STRUCTURE USE
TYPE OF BUS/INST
BUS/INST NAME
FLOOR
WALLS
ROOF
LENGTH/ WIDTH
REMARKS
1
MMT/001/A
1
BUSINESS CAMP
SHOP
OUR STOP
CEMENT
BLOCKS
IRON SHEETS
28*16
SHOP
2
MMT/002/A
2
RESIDENTIAL
SHOP
CEMENT
BLOCKS
IRON SHEETS
24*9
SHELTER
3
MMT/003/A
3
UNDER CONSTRUCTION
CEMENT
BLOCKS
IRON SHEETS
24*12
4
MMT/004/A
4
RESIDENTIAL
CEMENT
BLOCKS
IRON SHEETS
66*30
5
MMT/004/B
4
RESIDENTIAL
CEMENT
BLOCKS
IRON SHEETS
66*30
6
MMT/004/C
4
RESIDENTIAL
CEMENT
BLOCKS
IRON SHEETS
66*30
7
MMT/004/D
4
RESIDENTIAL
CEMENT
BLOCKS
IRON SHEETS
66*30
Data collection: Using GIS prepared shapefiles and printed on normal white paper, the trained team then moves across the settlement, picking all features of importance and represents them on the paper. Some of the features picked include
- Structures – these are represented as polygons on the paper and the mapping team will have a task of identifying the structures shown on the paper on the ground. After identifying them, they will then give the structures the numbers assigned on the ground and show the partitioning of the structures on the paper as they appear on the ground. Each partition may have its own number as per the families that live in it. Structures missing on the paper but identified on the ground are included on the paper by drawing. The drawing has to obey the scale used on the paper.
- Access Routes – these include roads and footpaths that facilitate access through the settlement. They are usually represented as lines on paper with a unique colour to differentiate them from other line features. They are useful since they provide orientation of the map as well as spatial and physical identification of the features.
- Power lines and Power posts – They are picked as lines and points respectively to be able to capture the electricity supply situation in the settlement. They are picked together with other features as the mapping team traverses the settlement.
- Water points – They are also picked as points with a unique identifier to help differentiate from other point features. They are useful to help capture the water situation within the settlement. In some cases, there may be different points for different water sources in order to help capture the different water sources within the settlement. Some of these may include boreholes, harvested rainwater stored in tanks, tap water as supplied by the Water Company and wells.
- Rivers – They are represented as line features. Rivers are very important because they have always provided reference locations for surveying work. This is due to the fact that unless otherwise the course of a river will not change naturally. Therefore rivers in this case will provide orientation for the map
- Sewerage facilities – These will include sewer lines and sewerage tanks to help provide situational analysis of the sewerage facilities within the settlement. Sewer lines are represented as lines whereas the sewerage tanks may be represented as either points or polygons (whichever will be appropriate).
- Dumping sites – These will be represented as either points or polygons in order to capture the dumping situation within the settlements.
- Drainage facilities – These will mainly be captured as line features. There may be categories depending on available drainage facilities. The categories can be for example in this case formal or informal depending on whether they are provided for by the municipality or by individuals themselves.
Data editing: The mapped information is then transferred back into the GIS database through GIS software such as ArcView, ArcGIS or QGIS. The original shapefiles which were printed to facilitate data collection are edited to capture the changes in structures as well as the new features that were picked on the ground. The original shapefiles were prepared form either a satellite imagery or an aerial photo using the GIS software. The features are visually identified and drawn to facilitate the preparation of the mapping shapefiles. This stage also includes spatial database creation, features symbolization, generation of thematic layers as well as linking of spatial and non spatial databases.
Map analysis: The edited map is then analyzed in GIS software to be able to bring out the situational analysis of the mapped settlement.
Map presentation: The resultant maps are then printed and taken back to the community. A forum is organized where the community members who participated in the mapping process as well as the rest of the community come to see the mapping results for their settlement and the community members are therefore challenged to own the map and use it as a negotiating tool for service provision, future planning as well as general well being of the community.
In essence, what the methodology is trying to achieve is to bring the local government and other probable stakeholders into contact with the community. This then becomes the arena of shared decision-making. At the same time, however, the methodology seeks to limit stakeholders involvement in those aspects of the project where it lacks an understanding of the underlying issues (or a capacity to deal with them), and where the community can manage the process more effectively.
This is the area of community-based decision-making. Such a differentiation is aided by the use of GIS, which can be used to build the capacity of both the local authority and other stakeholders and the specific community. In this way it is possible to deal with the realities of developing cities, where local government and other stakeholders often lacks the necessary capacity. Hence GIS provides a mechanism, in its capacity as a management tool, to identify clearly the division of responsibility between local government and community.
Mapping Process
Initial Preparatory Stages
The mapping process for Mrima settlements was arranged and agreed upon by the community members within these settlements. The process started with four out of the five clusters (Land, Nairobi area, Mathare and Madunguni). The four clusters were done during the months of October and November, 2010. The remaining cluster in this case was Majengo Mapya which was done in the month of December, 2010.
The image that formed the base map for this mapping exercise was an aerial photograph of the area acquired in September, 2009. The image was georeferenced in readiness for preparation of the vector maps. This was then prepared using G.I.S software (ArcGIS 9.4). As part of the preparation process, the image was digitized to pick features that can be visually identified (roads and structures).See figure 3 below

Figure 3: Mrima digitized structures
A process of ground truthing was carried out with the aid of the community members. It is at this stage that the settlement was clustered into five structures. The five structures came as a result of the five villages covered by the settlement where a village elder was to provide leadership for the given structure.Figure 4 shows these clusters.
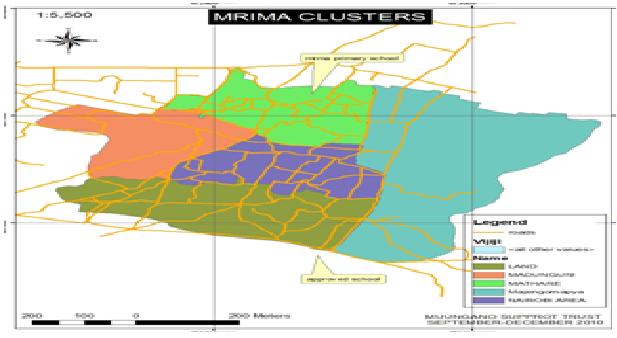
Figure 4: Mrima clusters
This was then followed by a numbering process where each cluster was given a unque code to be used throughout the process. The table below shows the different numbering codes for each cluster.
Table 2: Numbering cluster codes
Cluster
Cluster code
Example
Land
MLD
MLD/001/A
Nairobi Area
MNA
MNA/001/A
Madunguni
MMD
MMD/001/A
Mathare
MMT
MMT/001/A
Majengo Mapya
MMM
MMM/001/A
These numbering codes were developed through a training session that was conducted within the settlement. The numbers were unique in that they give a clear distinction between the different households within the cluster, the toilets, bathrooms, businesses and institutions. These were then recorded on a numbering sheet. Table 1 before shows an example of the numbering sheet used during this process.
After the numbering process had been done, the digitized features were used as the base information to aid in mapping process. Each numbered structure was drawn by the community mapping team on the mapping sheets provided to them. During the drawing three important rules were to be strictly adhered to.
a) The structures were to be drawn according to the scale provided. The drawn features (digitized) were already on scale and the any new drawing was to respect this scale. The community mappers were trained on how to achieve this.
b) The orientation of the structures was to be obeyed. This was meant to ensure that the orientation of any new structure was to relate to those of the already drawn ones. The team was also trained on how to be able to achieve this.
c) Replication of what exists on the ground. This was meant to ensure that the resultant map is a true representation of what exists as per that time.
Digital map production
This stage involved editing of the shapefiles, spatial database creation, features symbolization, generation of thematic layers, linking of spatial and non spatial databases.
The shapefiles were edited using the G.I.S software at the Muungano Support Trust offices. Based on the mapping sheets from the ground, the shapefiles were edited to incorporate the changes as well as production of the settlement map. The resultant map in this case is detailed to the household level. Figures 5,6,7,8 and 9 shows the edited maps for Land, Madunguni, Nairobi area, Mathare and Majengo mapya respectively.

Figure 5: The digital map for Land cluster of Mrima settlement
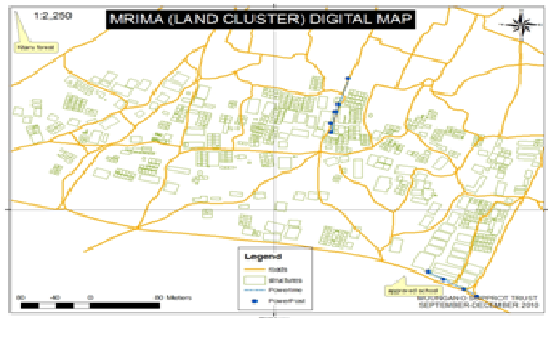
Figure 6: The digital map for Madunguni cluster of Mrima settlement

Figure 7: The digital map for Nairobi area cluster of Mrima settlement

Figure 8: The digital map for Mathare cluster of Mrima settlement
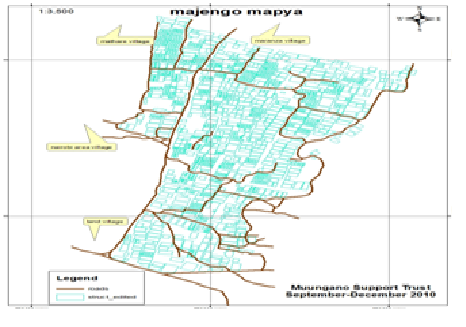
Figure 9: The digital map for Majengo Mapya cluster of Mrima settlement
Achievements
Some of the achievements during this mapping period can be summarized as follows:
- The mapping team was developed which can be dependable for future mapping activities within the Likoni network
- The exchange program for the visitors; where they got an opportunity to learn from both the MuST staff members as well as the Muungano members. Visitors from Uganda and Tanzania had visited the area during the mapping process and hence got an opportunity to interact with the community members.
- The formation of a Muungano sub-network in Mrima where six people were chosen by the community members to help mama Fatuma Nuri in organizing Muungano activities. They include Rashid Mwamari, Binti Hamisi, Mwinyi Abdullah, Isaac Odhiambo, Nkulewa Salim and Abdala Mazera.
- A MuST staff had a chance to see some of the projects ongoing in Likoni which include Childcare and Poultry rearing.
Having finished the initial mapping process for the entire Mrima settlement, a stage was therefore set for Enumerations as well as Verification of the collected map data.